Bus drivers have hard jobs. They drive very large vehicles on all kinds of roads, over long periods of time, and under varied conditions. It’s one of those jobs that you can do well for years and no one will say anything, and the one day that an incident occurs can end in tragedy for a rider, or sharp disciplinary action against the driver.
One of our big surprises over the years has been that many good drivers aren’t afraid of the new monitoring technologies, and even embrace them. Rather than look at GPS tracking, cameras, etc. as someone looking over their shoulder, drivers have an unbiased and ever-present observer to stand up for them against unfair accusations.
BusWhere has been used to highlight bad driving. But it has also been used to refute rider claims that were exaggerated or patently false. Truth and facts are always helpful in productive conversation.
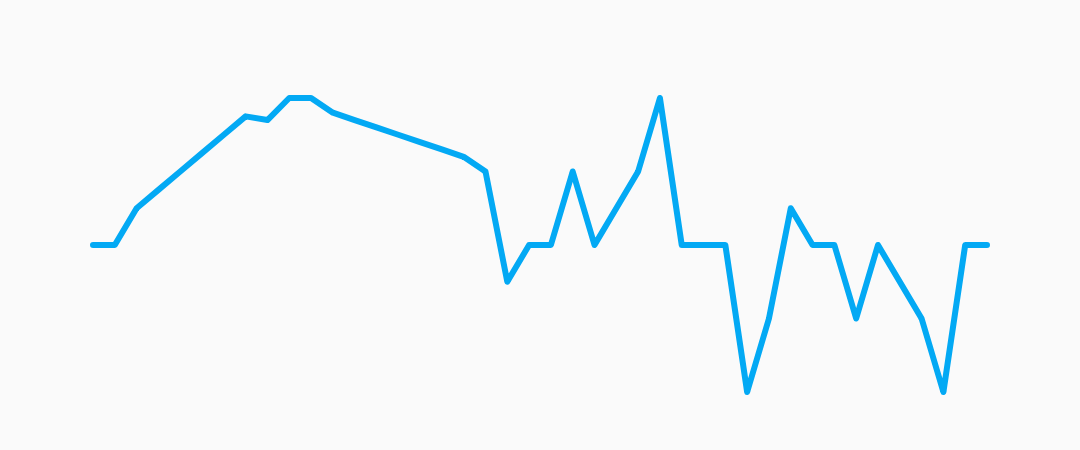
I am excited to announce the rollout of our new Safety Record Sparklines:
![]()
A sparkline is defined by Wikipedia as: “A very small line chart, typically drawn without axes or coordinates. It presents the general shape of the variation in some measurement, such as temperature or stock market price, in a simple and highly condensed way.”
The picture above represents 30 DAYS of data, recorded every 5 seconds, 24 hours/day, or up to a HALF-MILLION data points. When a safety incident is recorded by our tracker (eg hard braking, hard acceleration, sudden right or left turn), we record this in the vehicle log history. Mousing over any of the orange or red bars reveals a popup with the date and the number of incidents on that date. More than 8 incidents on a single day will show up as a red bar.
Administrators can glance at dozens of sparklines in a few seconds, and distill millions of data reports into a single conclusion “Bus 26 has an unusually large number of safety incidents in the last 2 weeks”.
Clicking on any of the bars will open up our interactive route trace to the day in question, with the safety incidents indicated by an orange square on the timeline. Administrators can drag forward and backward through a route to view interactively what happened on that day and provide context for the safety incident.
In most cases this investigation provides general information about bus history, and an active sparkline doesn’t a bad driver make — we have all slammed on the brakes in order to PREVENT an accident. In some cases a very active sparkline will trigger important conversations with a driver about what happened on a given day.
BusWhere Safety Record Sparklines are part of our ongoing commitment to easy-to-use administrator tools, and improved safety and communication through visual data. If you are already a BusWhere administrator, take a look and let us know what you think! Or if you’d like to get started with BusWhere for your organization, please drop us a note at support@buswhere.com.